What's all this do?
When you enter melodies into the Music Ngram Viewer, it displays a graph showing how those melodies have occurred in a corpus of scores (e.g., "IMSLP") over the years. Let's look at a sample graph:
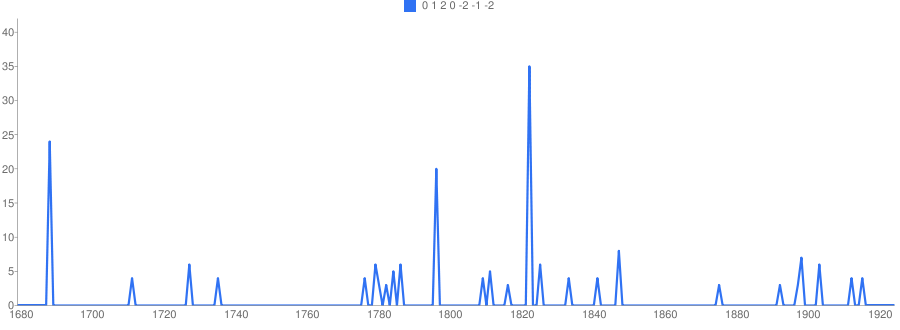
This shows occurrences of the Ode to Joy motif from Beethoven's Ninth Symphony, encoded differentially (the numbers represent differences between consequent notes) - a 7-gram, "0 1 2 0 -2 -1 -2". What the y-axis shows is this: of all the 7-grams contained in the OMR'ed (optically recognized) scores from IMSLP, the Petrucci Music Library, how many are identical with the first 8 notes of Ode to Joy up to a patch shift? Here, you can see that use of the graph peaks around 1822 - the year of the Ninth's composition. Apparently, the score of the Ninth symphony contains most occurrences of this pattern. Interesting, what are the other peaks?
Corpus
The data for Music Ngram Viewer comes from around 1,600,000 OMR'ed sheets from some 160 thousand scores from the Petrucci Music Library, the Library of Congress and the Duke University Library. They contain almost 370 million notes. The scores are currently still being recognized. We will update this corpus as the digitization continues.
Currently the database contains ngrams up to the length 15, or melodies of up to sixteen notes or chords. This makes roughly 360 million melody-year pairs.
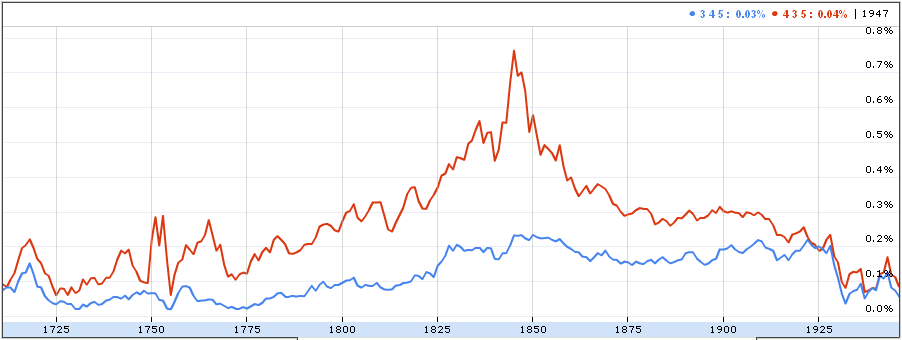
Here is a chart showing the frequency of occurrence of major and minor
chords:
Searching inside Music Scores
You can get the list of scores containing the given melody. Time periods are chosen so that the melody occurs roughly the same number of times in each of them. For each period you can view up to 88 scores.
But but but...
What about polyphony? How are the chords represented?
For melody search we linearize the scores in the following way. First, we consider different voices separately, so for example two hands in piano pieces are indexed independently. Second, for each voice we flatten the chords, representing them as melodies going upwards.
Is the melody search not too limiting? I'm interested in rhythmic patterns, harmonic progressions and other musical objects.
Sure, we want to have them as well! In the next releases we will add more search and ngram indexes, which will help to explore and navigate the scores in more meaningful ways. Stay tuned!
Why do I see spikes and plateaus in early years and in the last 85 years?
Publishing was a relatively rare event before the 18th century, and scores published in the last 85 years are mostly copyrighted and therefore unavailable in our corpus. So if a melody occurs in one score in one year but not in the preceding or following years, that creates a taller spike than it would in later years.
Plateaus are usually simply smoothed spikes. Change the smoothing to 0.
Here is a graph of the number of occurrences of twelve intervals from
the minor second to the octave, by year:
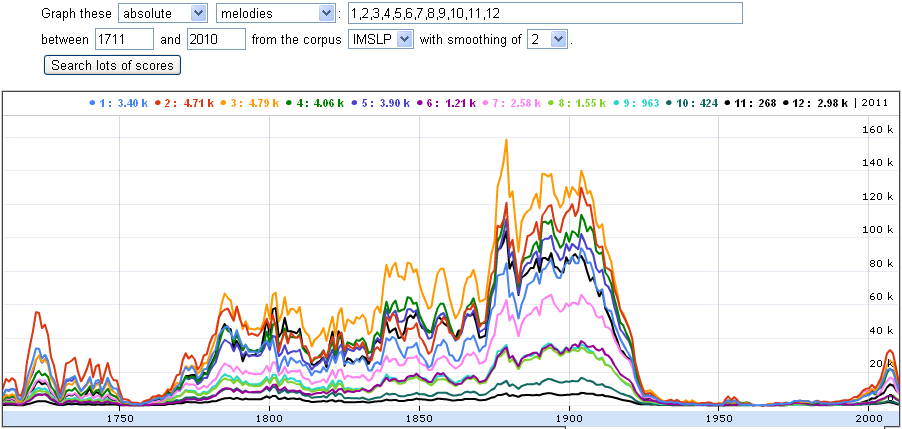
The gap between 1925 and 2000 is due to scores still being under copyright protection and hence unavailable on IMSLP. Modern composers, however, are free to upload their compositions, and indeed they do so, as the bump on the right tells.
Here is the data for the same time frame and same intervals, but this time
it is normalized by the total number of notes published in a given year.
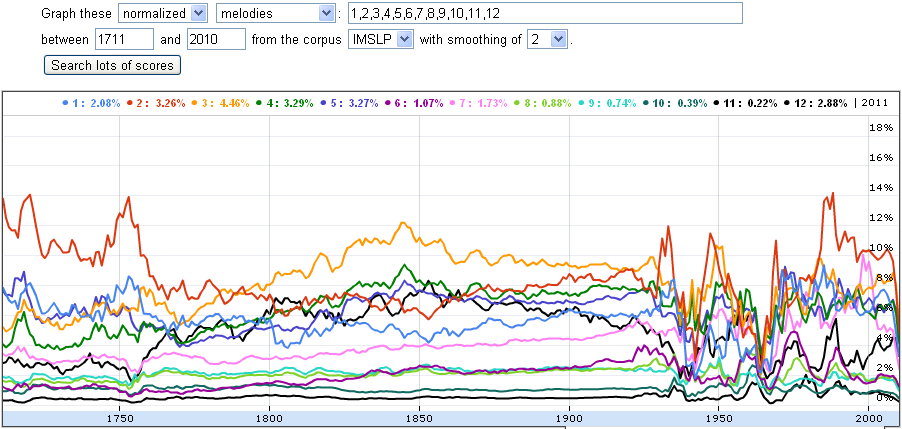
The more scores we have available, the smoother the curves.
What does "smoothing" mean?
Often trends become more apparent when data is viewed as a moving average. A smoothing of 1 means that the data shown for 1850 will be an average of the raw count for 1850 plus 1 value on either wide: ("count for 1849" + "count for 1980" + "count for 1981"), divided by 3. So a smoothing of 10 means that 21 values will be averaged: 10 on either side, plus the target value in the center of them.
At the left and right edges of the graph, fewer values are averaged. With a smoothing of 3, the leftmost value (pretend it's the year 1850) will be calculated as ("count for 1850" + "count for 1981" + "count for 1852" + "count for 1853"), divided by 4.
A smoothing of 0 means no smoothing at all: just raw data.
Many more scores are published in nineteenth century. Doesn't this skew the results?
It would if we didn't normalize by the number of notes published in each year.
Why are you showing a 0% flatline when I know the melody in my query occurred in at least one score?
We only consider ngrams that occur at least 3 times in a given year. Otherwise the dataset would balloon in size and my server won't be able to handle them all. Also, the accuracy of optical music recognition is still far from perfect, so it can be that the printed melody was not recognized properly.